Adding Charts
Adding a chart to your slide is easy as pie.
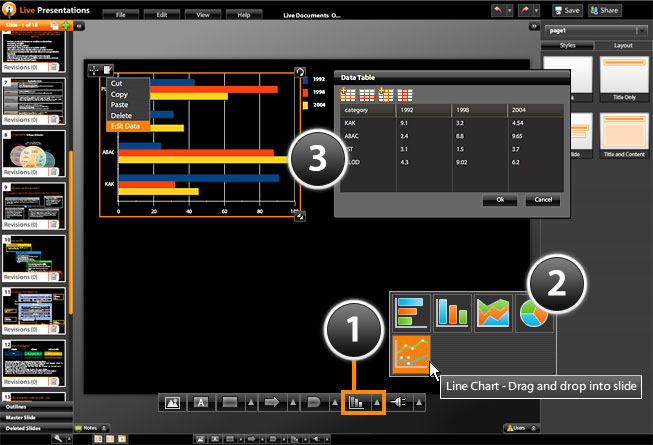
- Click on the charts icon on the toolbar at the bottom
- Select the chart type that you want to insert and drag and drop it into the slide
- Click Edit Chart Data to open the Chart Data window. Click on any of the data entries to edit them. Click Add Row to add data and Delete Row to remove it.
You will notice that the properties panel on the right is automatically updated to allow you to change chart properties like data and appearance. You can also add effects and animations to your chart
You can also quickly change the look of your chart by clicking on the "Preset chart styles" button in the properties panel and selecting one of the professional chart formats.